Insights, patterns and the growth chart
The Insights tab shows the stats you pin, a week of patterns and all stats. Tap Weight, Length or Head circumference to see growth over percentile curves.

Insights looks back over days and weeks. For today alone, use the pills on Home; see Today so far and “usual”.
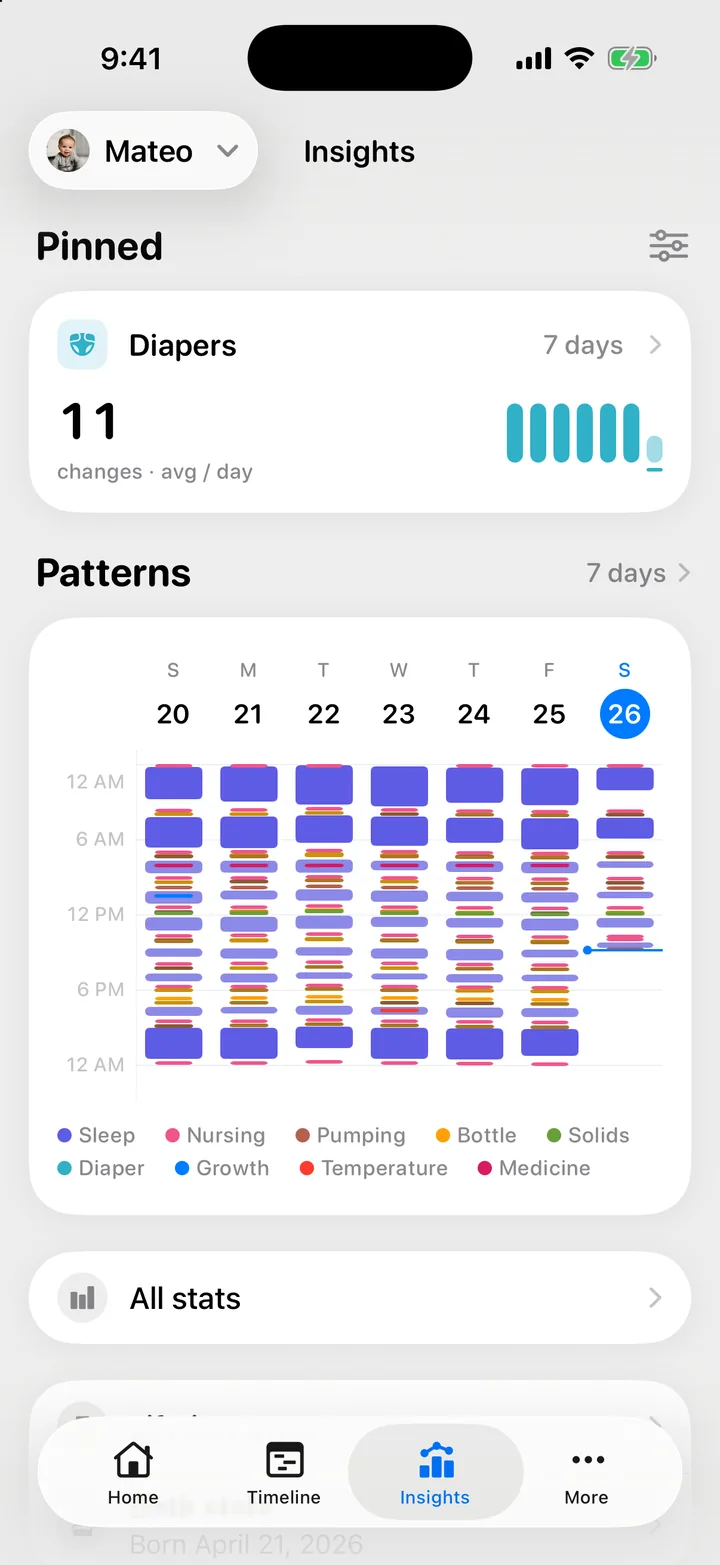
Pinned stats
The cards at the top are your pinned stats. Each card sums up the last 7 days. Tap a card to open its page.
To choose which stats show:
- Tap the button beside Pinned (Edit pinned stats).
- Tap the minus button to unpin a stat, or the pin button beside a stat under its category to pin it. Drag to reorder.
- Tap Done.
Insights keeps at least one pinned stat. You can also pin or unpin from a stat’s own page with Pin to Insights.
A stat’s page
Each page has a chart and the figures behind it. Choose the range at the top: 7D, 30D, 3M or All (7 days, 30 days, 3 months or your child’s whole life). The line under it shows the dates. Each page remembers its own range. For a young child, only the ranges your child has already lived through show.
Every stat
Tap All stats for the full list, grouped as Sleep, Feeds, Diapers, Pumping, Growth and Health. Type in Search stats to find one. A stat you have not logged yet shows a dash.
The growth chart
Growth has three stats: Weight, Length and Head circumference. Pin one, or find it under Growth in All stats. On the page, switch between Weight, Length and Head at the top.
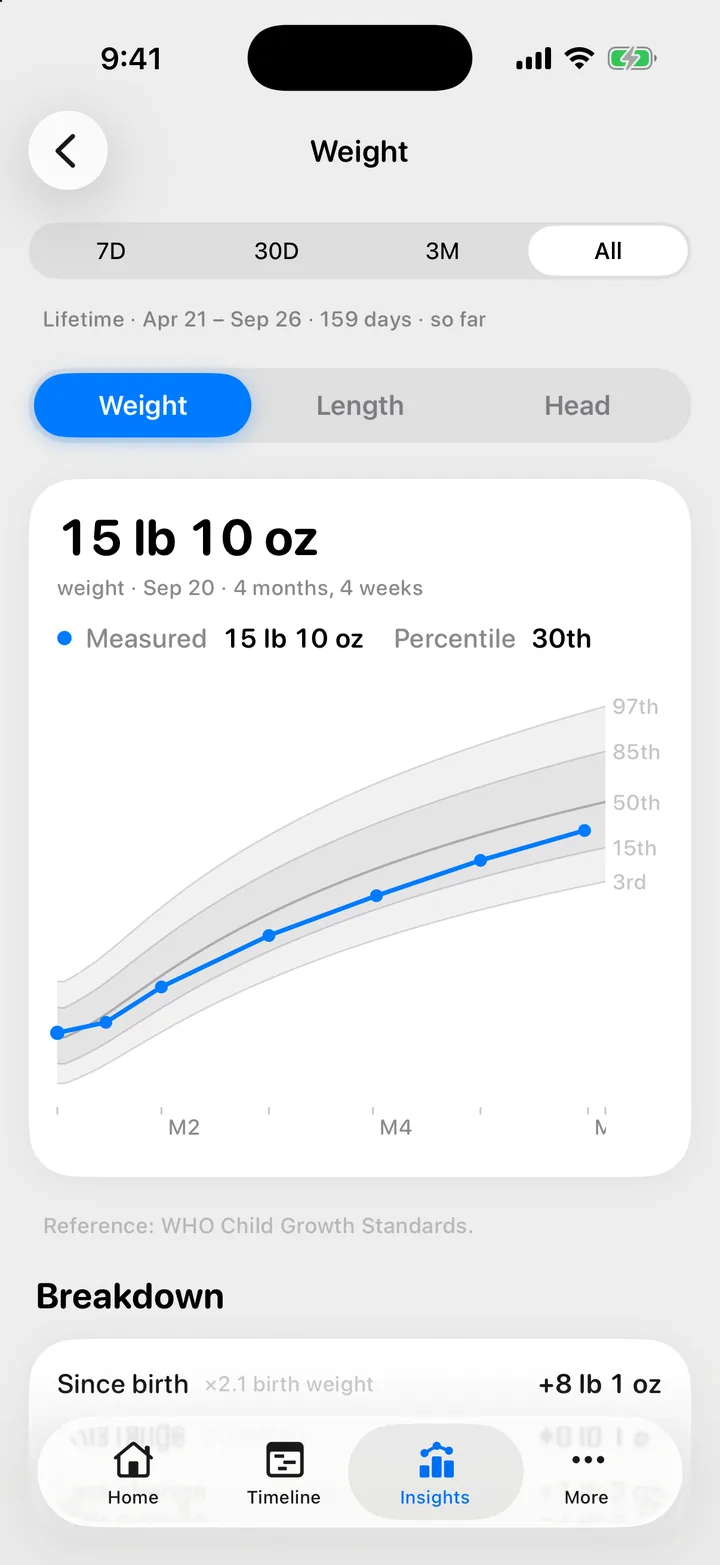
The chart draws your child’s measurements by age, over percentile curves from the 3rd to the 97th. The figures show the latest value and its Percentile. Units follow More, Settings, General, Measurements.
The chart needs two things from your child’s profile, in More, Children, your child, Birth Details:
- A birth date, because growth is drawn against age.
- Girl or Boy, because the percentile curves differ. Without it, the chart shows no percentiles.
The curves go up to age five.
Troubleshooting
Insights asks for a birth date
Add the birth date in More, Children, your child, Birth Details. Stats and growth are counted from it.
I don't see percentiles
Set Girl or Boy in Birth Details.

Still need help?
Write to us and a person reads it, usually within a day. From the app, Send Feedback attaches the details that help us fix it.
In Cami: More › Settings › Send Feedback